Launch the API Manager
-
Launch your API Connect service from IBM Bluemix.
-
Click on the
Sandboxcatalog tile. -
From the
Sandboxcatalog configuration screen, click on theAnalyticstab.
Explore the Analytics
-
The default dashboard gives some general information like the five most active Products and 5 most active APIs. This information is interesting, but there are other dashboards we can view that provide more data.
-
Click on the
Load Saved Dashboardsicon to open up the dashboard list. Select theapi-defaultdashboard.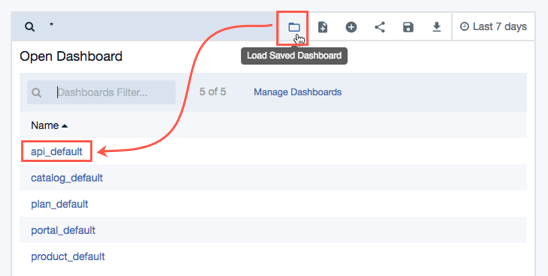
-
Here you will see some interesting visualizations that show graphs and charts with information about the API Traffic that was processed.
Tip:
Visualizations are queries into the data. You can move the visualization boxes around the dashboard and resize them. You can also add more visualizations to the dashboard, or customize the data queries of the existing ones. Once you have the dashboard the way you like it, you can save it and pull it back up any time you wish. -
Analytics data can be filtered over different time periods, and the visualization boxes can even be automatically refreshed. Click on the calendar icon which specifies the default time period of
Last 7 days.
-
Set the Time Range to
Today. -
Click on
Auto Refreshand set the refresh period to5 seconds.
-
Return to the consumer application in the Chrome web browser. Navigate around the site and test out some of the features in order to generate some additional API calls.
-
Return back to the analytics view and notice how the data is refreshed automatically.
Completion
Congratulations! You have completed all of the labs!